
STEM + EDX Spectrum Imaging and Basic Analysis
EDX spectrum imaging from user-specified arrays of points
Traditional EDX spectrum imaging
Combination of STEM control of the beam position with simultaneous readout of EDX spectra
Acquisition from user-defined points, line profiles, and user-defined areas
Acquisition from each user-defined point runs up to the specified time
Basic analysis — integrated peak intensity profiles or images
Intuitive workflow
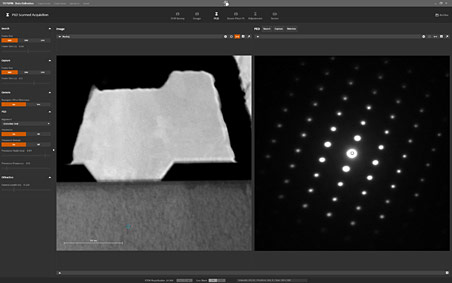 Screenshot Topspin User Interaction – GaN HEMT
(STEM & Precession Electron Diffraction)
 Mayenite mineral electron diffraction pattern
(changing precession angle 0-3 deg)